Month: December 2020

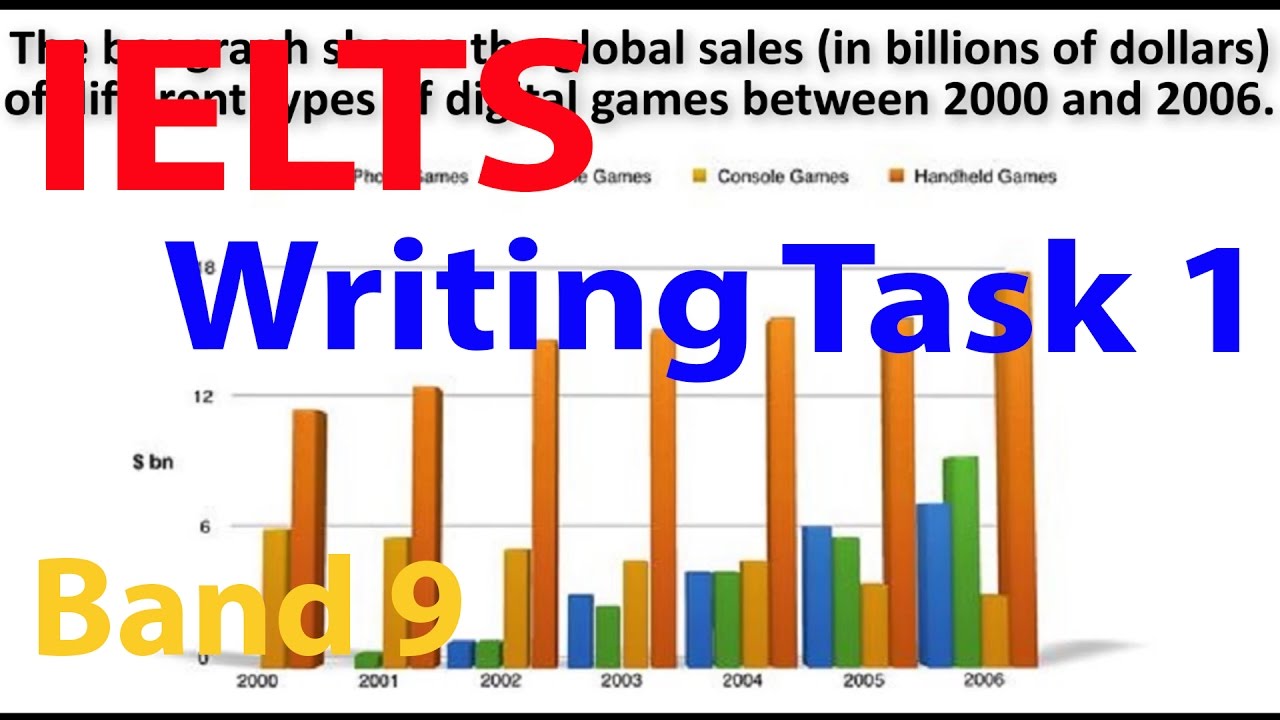
How to describe a bar CHART

There are a couple of different structures you can follow when describing an IELTS Bar Chart. These are very important in academic writing. But today we will teach you a structure where you assign each sentence of your text to a topic – kind of the opposite of what you usually do when writing task 2.

IELTS Pie Chart: Overview, Writing Strategies, Tips and Samples

In writing module, task 1, of the academic section there will be a visual representation or a diagram on which you have to write a paragraph. One of these visual representations may be pie charts. Pie Charts are the circular charts that are divided into sections or pie slices usually representing the percentages. Each section of the pie chart shows the percentage of data that it represents. When you put all the sections together it forms a circle. The Pie charts are most commonly used in multimedia and business world and less commonly used in scientific and technical publications.

How to write Advantage and disadvantage essay

The first step to scoring well in IELTS writing task 2 general is to correctly identify the type of essay being asked to write. In advantages and disadvantages essay type, IELTS examiners want you to discuss both advantages and disadvantages separately and at the end, you need to write conclusive statements for the latest IELTS writing task 2.

How to Describe a Table in IELTS Writing Task 1?

In IELTS writing task 1 of academic module, you find different types of diagrammatic questions. Table is one of such questions that can be asked in IELTS writing task 1. Table questions appear in different ways in the exam. There can be a single table or two tables. It can also be the case that you have a table with a combination of other diagram such as bar chart, line graph or pie chart. Whatever the question is, you can follow the below easy steps in order to describe a table effectively.