How to Describe a Table in IELTS Writing Task 1?
This post is about how to describe a table in IELTS writing task 1?
Important factors for scoring good band scores in IELTS Writing Task 1 Table:
Task achievement: The essay should identify a major point of interest in the data and supports with relevant figures from the table.
Coherence and cohesion: The essay should organise into paragraphs which are connected logically. There is an overall description at the beginning or at end of the answer.
Lexical resource: The essay should use vocabulary appropriate to comparing data such as ‘accounted for’ and ‘witnessed a significant rise’. Native-like collocation is used throughout the model answer.
Grammatical range and accuracy: The essay should include many examples of complex sentences that combine a main point with supporting evidence in two clauses.


In IELTS writing task 1 of academic module, you find different types of diagrammatic questions. Table is one of such questions that can be asked in IELTS writing task 1. Table questions appear in different ways in the exam. There can be a single table or two tables. It can also be the case that you have a table with a combination of other diagram such as bar chart, line graph or pie chart. Whatever the question is, you can follow the below easy steps in order to describe a table effectively.
The first step to follow in any type of question in IELTS writing task 1 is to read the question carefully and understand it well. In the question statement, you will find the basic information of what the table is about and then you can check the table heading which would also give you more clarity of the question. Afterwards, you can check the main headings of columns and rows with a slight glare at the figures. Do not analyse the figures deeply at this stage.
How to Describe a Table in IELTS Writing Task 1 : Tips and Tricks
We will have a look at the following parts:
- Introduction
- General Overview
- In-depth analysis
- General tips
Introduction
Your introduction should be quite impressive as it makes the first impression on the examiner. It could potentially make or break your overall score!
If there are multiple graphs and each one presents a different type of data, you can write which graph represents what type of data and use ‘while’ to show a connection.
For example: The given bar graph shows the amount spent on fast food items in 2009 in the UK, while the pie chart presents a comparison of people’s ages who spent more on fast food.
For multiple graphs and/ or table(s), you can write what they present in combination instead of saying which each graph depicts.
Your introduction alone should be about 20 to 30 words.
General overview
You can write your introduction (paraphrasing the question) and General overview in the same paragraph, or you can also write both in separate paragraphs. It doesn’t really matter which you chose, but you will have to write both!
Never provide any data (give numbers, percentages or quantity) in your general overview. You only start discussing the data in detail in the in-depth part. So, you should give the most striking features of the graph that could be easily understood at a glance.
- In your general overview do not write:
At first glance the graphs reveals that 70% of the male were employed in 2001, while 40 thousand women in this year had jobs.
- Instead write:
- At first glance the graphs reveals that more men were employed than their female counterparts in 2001 and that almost two-third of the females were jobless in the same year.
Your Introduction (paraphrasing the question + general overview) should have a word count of about 75 – 80 words.

In-depth analysis
Your in-depth analysis is the next part of your writing and the biggest chunk of the task. So, it should have about 75-80 words. Combined with the 75-80 words of your introduction and General overview you have your 150 to 160 words. This means you have covered the 150 word count.
Depending on the question, you can either use 1 or 2 paragraphs for the body of the in-depth analysis. Just remember to group things together logically.
General tips
Take time to analyse and plan your writing, these are essential parts of any writing. It makes sure you know what you are writing about and it saves time when you are writing.
Write in pencil, that way you can easily correct your mistakes in the final 2 minutes, as well as replace words by synonyms if you are using the same words too often.
Make your point clearly
How you structure your answer can help set the overall flow of your answer.
Usually, two main paragraphs will be used so that you can describe each group of data. That means that one group of data would be described in one paragraph whilst the second group of data would be a new a paragraph.
This keeps things organised and helps you keep track of your overall point.
Compare & Contrast with Exceptions
For example, the first paragraph could be comparing the data whilst the second paragraph is talking this in more detail, whilst a final summary sentence ties it all nicely.
This helps you stay on track and easily cover all the IELTS bases too.
Be a master and prepare fully with these tips
Use practice tests – the more experience, the better!
Review sample essays.
Time yourself as you practice more and more.
Try answering the question without using a dictionary.
Click here for more help with your IELTS Academic Task 1 .
IELTS Table Vocabulary Phrases
Warning: Use these in context.
An inspection of the data in the first table clearly shows
It is apparent from this table that considerable …
In the third column there is a distinct trend of …
What stands out in the table is …
Closer inspection of the table shows …
As the table shows, there is a significant decrease …
There is a significant difference between column A and column B, most notably…
An inspection of the data in the table reveals that…
What stands out in this table …
…is the general pattern of
…is the difference between
…is the wide disparity between
…is the rapid increase of
…is the growth of
…is the high rate of
Fancy Sentences
The figure for 1999 is almost three times that of 2010.
The figure for 2011 is exactly four times that of 2010.
It is clear that the figures between 2001 and 2010 are broadly in the same range.
Grouping
The figures between 1999 and 2000 are very similar to those of the prior year.
The figures in column A and B are almost identical.
Have a look at some more IELTS writing task tutorials.
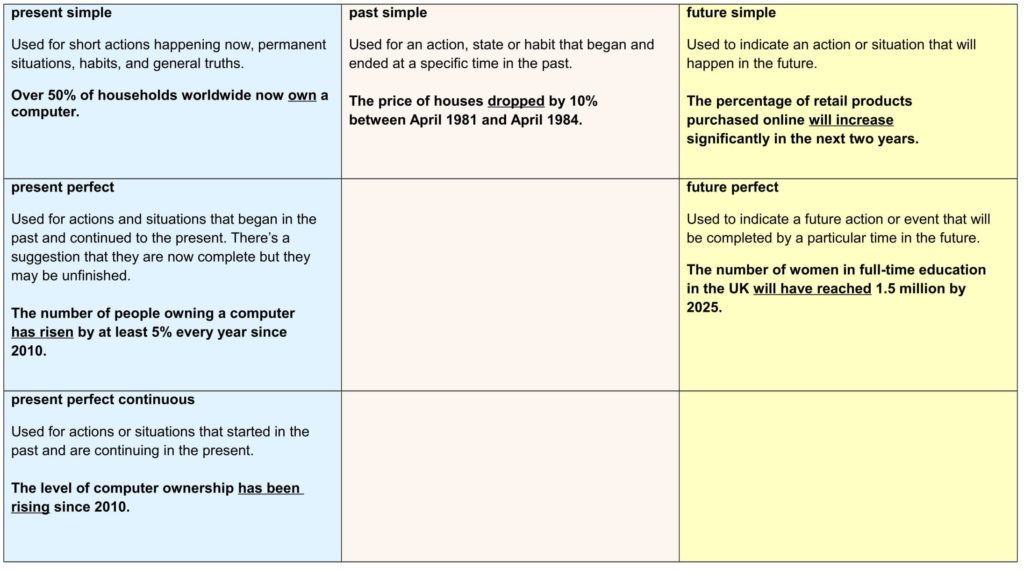
HOW TO DESCRIBE A TABLE IN IELTS WRITING TASK 1 : Tenses
Use past simple (e.g. “increased) to write about the past.
Basic Example: “The number of people increased…” or “Several houses were built in the northern area…”
Whenever you are writing about the past, use past simple (e.g. “was”, “increased”). It’s no problem if you use present perfect (e.g. “have increased) or past perfect (e.g. “had increased”) if it’s correct, but most of the time it’s unnecessary.


The choice of which tense to use will be determined by whether or not the graphic contains dates and, if it does, whether the dates are in the past or the future.
Follow these guidelines:
- No date – use the present tense
- Dates in the past – use the past tense
- Dates in the future – use the future tense
The tenses you are most likely to need are:
– Present tense – present simple, present perfect or present perfect continuous
If we don’t have dates, and so present tense must be used.
For example,
Cooking utilises 5%, standby 5% and lighting 11% with total utilisation of 21% of the power while refrigerators need 12% electricity. All other appliances consume the rest 24% of the energy share.
– Past tense – past simple
If the dates are in the past, you would have to use Past Tense.
For example,
Among the full-time employed people, men had about 45 hours of leisure time on an average per week compared to the almost 38 hours of leisure time for women.
– Future tense – future simple or the future perfect
If the dates are in the future, you would have to use future tense.
For example,
The life expectancy is predicted to rise in every country, which will be 23% and 25 per cent in 1940 in Sweden and USA respectively.
The table below gives explanations of these verb tenses and examples from Task 1 essays.

How to Describe Trends
The two most useful grammatical structures for describing trends are:
1) Noun phrase + verb + adverb
For example,
The number of unemployed women fell significantly.
2) There + be + adjective + in + noun phrase
For example:
There was a dramatic improvement in the percentage of people in employment.


How to Describe Increases and Decreases
The two most useful grammatical structures for describing increases and decreases are:
1) Noun phrase + verb + adverb
For example,
The popularity of social media climbed steadily.
2) There + be + noun + in + noun phrase
For example,
There was a fluctuation in university applications.
There is now a swimming pool in the location of the old factory.
How to Make Comparisons
1) More/fewer/less + noun + than
For example,
More teenagers play computer games than a sport.
2) Most/least + adjective
For example,
The most common childhood illness in 1979 was chickenpox.
3) More/less + adjective + than
For example,
Cruises were more popular than beach holidays in 2012.
4) High/low/few -er + than
For example,
A lower number of teenagers play a sport than play computer games.
5) High/low/large/small -est
For example,
The largest proportion of immigrants came from Mexico.
These sentence structures are valuable tools for getting high marks for your Writing IELTS Task 1 essay, so practice using them.
2 Common Grammatical Errors
For many students, two aspects of grammar that are a particular problem are:
- Prepositions
- Articles
Prepositions
There are two specific prepositions that you will probably use numerous times in your Task 1 essay when reporting change – ‘in’ and ‘of’. They are easy to get wrong.
Follow this general rule:
- When stating the specific value of the change (number, amount, percentage etc.) – use ‘of’.
- When stating what has changed – use ‘in’.
For example:
- An increase of 20%.
- An increase in the number of over 60’s taking exercise classes.
- A drop of almost a half.
- A drop in house prices.
- An improvement of 45 units per week.
- An improvement in retail sales from April to June.
‘Of’ is also used after a value. You will probably want to use proportional values in your Task 1 essay so here are some examples.
- a small percentage of
- just under a quarter of
- exactly a half of
- roughly three quarters of
- a significant majority of
- a high number of
Articles
Many languages do not have articles, and native speakers of those languages can find it a huge challenge to remember to use them.
In English, there are three articles – the, a, and an. Each is used in specific instances.
1) With singular and plural nouns:
- Use the before singular and plural nouns when the noun is a specific thing. For example,
The bar graph illustrates how many male and female students were studying full-time and part-time in Britain during the years 1970/1971, 1980/1 and 1990/1.
- Use a or an before a singular noun or noun phrase when the noun is non-specific and could be any one of a group or type.
- Use a before a noun or noun phrase beginning with a consonant. Use an before a noun or noun phrase beginning with a vowel.
For example,
Less than 30% of the population took a foreign holiday between 1975 and 1985.
There was an upward trend in families taking an annual holiday abroad after 1990.
2) Noun combinations:
Also, use a/an before adjective singular noun combinations such as these from our preposition list:
- a small percentage of
- an insignificant minority of
- a high number of
The key to improving your grammar is to know your weaknesses and focus on these as you practice and when you check your work in the exam.
We now have everything we need to begin planning and writing our IELTS table chart essay.
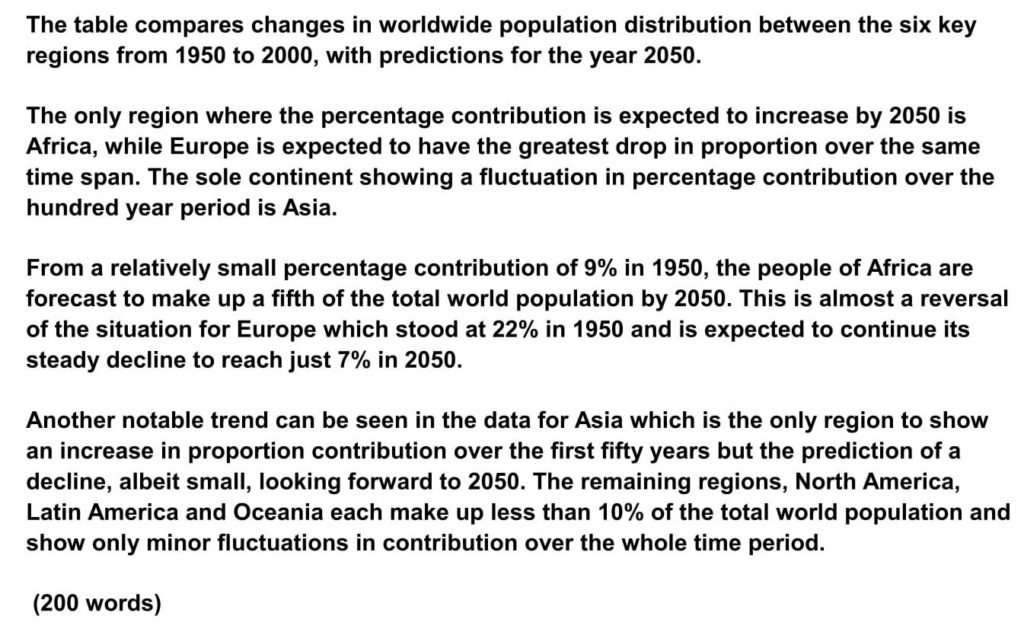
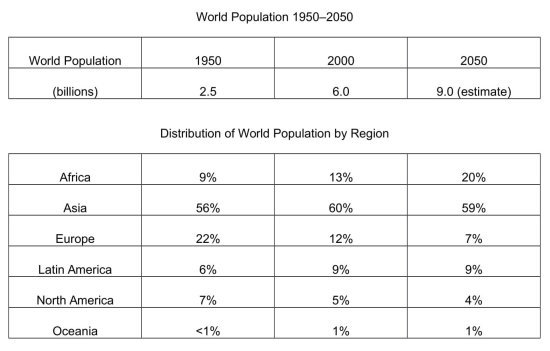
How to Describe a Table in IELTS Writing Task 1 : Sample Question
Here’s our practice question:
The tables below give the distribution of world population in 1950 and 2000, with an estimate of the situation in 2050.
Summarise the information by selecting and reporting the main features, and make comparisons where relevant.
Write at least 150 words.

Finished IELTS Table Chart Essay