

RECENT IELTS WRITING TEST TASK 1 (ACADEMIC) WITH SAMPLE ANSWER AND COMPLETE EXPLANATION OF TASK 1

How to write :
RECENT IELTS WRITING TEST TASK 1 (ACADEMIC) WITH SAMPLE ANSWER AND COMPLETE EXPLANATION OF TASK 1
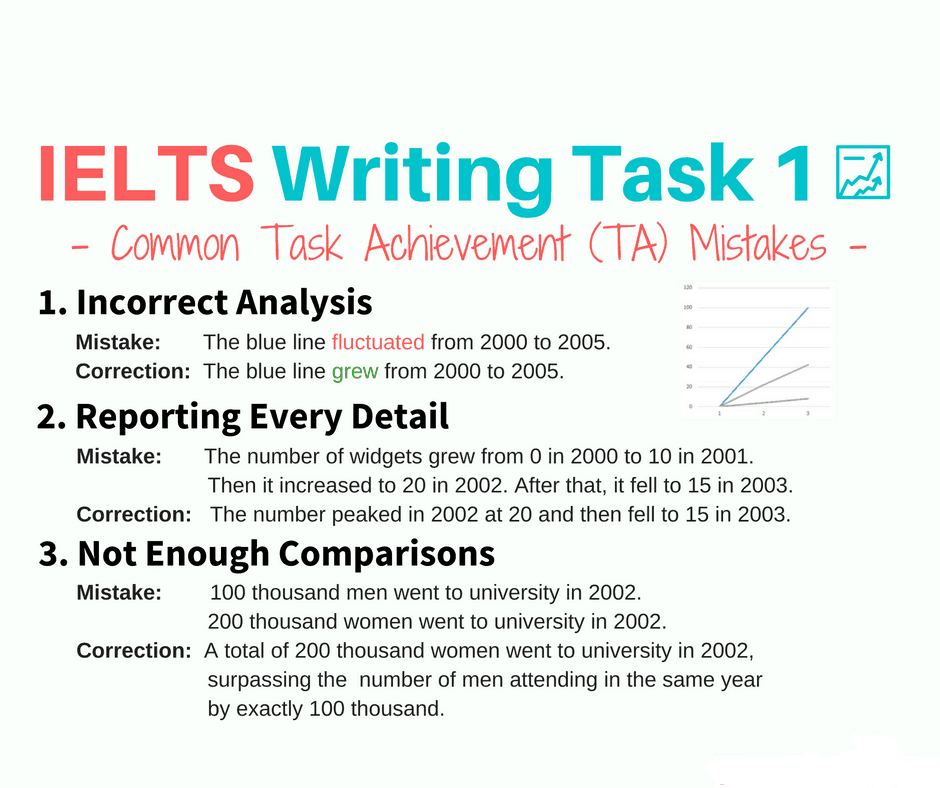
The writing task 1 consists of brief detailing of whatever information is given in the given picture which covers the whole schema of the given graph like when, where, what (3W) approach. No data/details should b missing. Also, you can add a summary/overall/overview of the picture in the introduction paragraph.


Introduction : Paraphrase: shows>compares; in terms of; hosted; between 1980 and 2010.
Overall/Overview/summary paragraph: (1) the number of conferences declined in Cities A and B (2) contrast rapid increase in the figures for City C.
Body Paragraph 1: City A and City B: compare 1980 numbers; give numbers for 2005, when both cities hosted the same number of international conferences; compare final numbers in 2010.
Body Paragraph 2: contrast City C trend and numbers, giving figures for 1980, 1990, 2000 and 2010.
IELTS Writing Task 1 : Lessons, Tips and strategies
In the IELTS writing Task 1 for academic you have to describe some kind of graph, diagram, map or process which would be in the form of picture.
Here you will get all the tips and tricks you will need for writing about the Task 1, or to find out how to improve your score if it has been too low.
There are three basic things you need to structure an IELTS writing task 1.
- Introduce the graph
- Give an overview
- Compare and contrast in body paragraphs
We’ll look at each of these in turn.
1) Introduce the Graph
You need to begin with one or two sentences that state what the IELTS writing task 1 shows. To do this, paraphrase the title of the graph, making sure you put in a time frame if there is one. No detail about the picture should be missing in the intro
2) Give an Overview
You also need to state what the main trend or trends in the graph are. Don’t give detail such as data here, you are just looking for something that describes what is happening overall. Just write a brief summary or you can say an overview.
One thing that stands out in this graph is that one type of fast food fell over the period, whilst the other two increased, so this would be a good overview. It can be in increasing or decreasing pattern of the data or the maximum or minimum pattern of the data.
You may sometimes see this overview as a conclusion. It does not matter if you put it in the conclusion or the introduction when you do an IELTS writing task 1, but you should provide an overview in one of these places, no matter where you are providing.
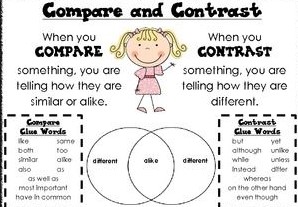
3) Compare and contrast in body paragraphs
You can now give more specific detail in the body paragraphs.
When you give the detail in your body paragraphs in your IELTS writing task 1, you must make reference to the data.
The key to organizing your body paragraphs for an IELTS writing task 1 is to group data together where there are pattern.
To do this you need to identify any similarities and differences about the given data.
Look at the graph – what things are similar and what things are different? This is very important to differentiate because the whole task depends on it.
How good you can categorize and how good you can differentiate, can vary your band score for the task. After that its just a matter of words. because you just have to write it in words.
So it is clear that pizza and hamburgers were following a similar pattern, but fish and chips were different. On this basis, you can use these as your ‘groups’, and focus one paragraph on fish and chip and the other one on pizza and hamburgers.
What is compare and contrast?
Basically compare and contrast is an idiom which we use to tell what is similar and what is different about something. that is it.

IELTS writing Task 1 vocabulary :
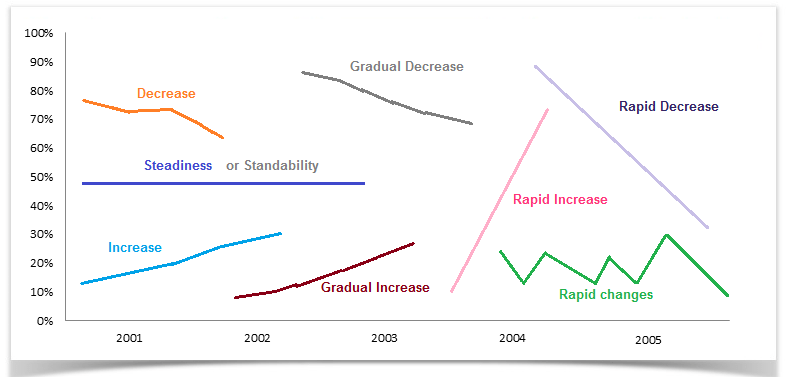
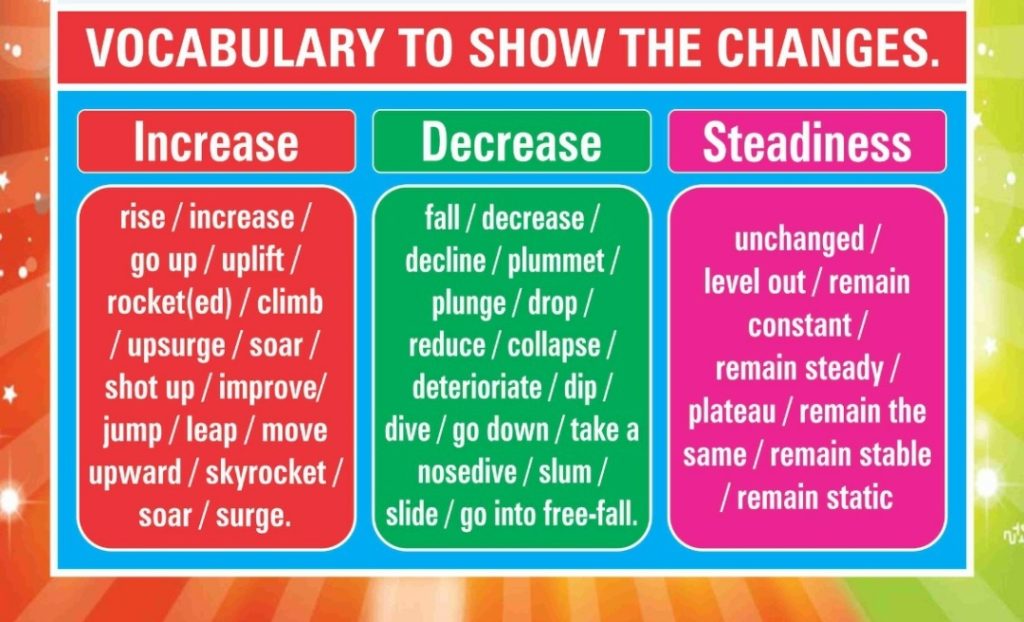
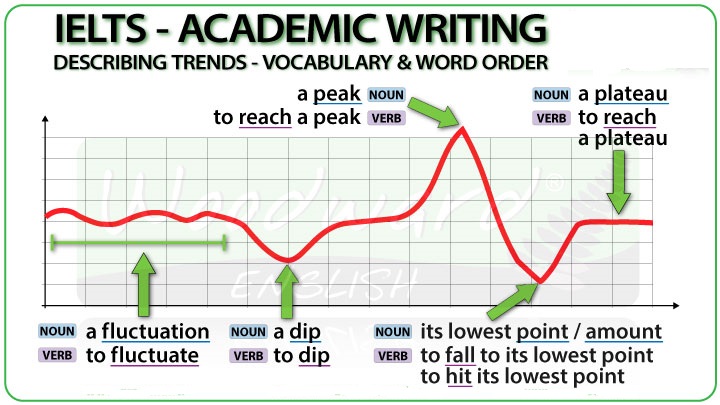
People usually face difficulty to justify the changes occurring in the IELTS writing task 1 graph, vocabulary for the changes is very important and the trend of change in the graph are explained in the following image :

Basic vocabulary for the IELTS writing task 1 graph is as follows:

Here’s is an example of describing IELTS Writing Task 1

What are adverb and adjective in IELTS writing task 1?
In IELTS writing task 1 you may have to describe trends. This may come up in a line graph, bar chart or when comparing more than one chart.
There are two main grammatical structures we can use to describe trends.
- There + be + adj. + noun + in + noun phrase
Example:
There was a gradual rise in the price of oil.
There has been a sharp drop in the price of oil.
Possible adjectives
- gradual
- moderate
- modest
- sharp
- dramatic
- slight
- steep
- steady
- significant
- considerable
- rapid
Possible nouns:
- variation
- decline
- decrease
- dip
- drop
- fall
- peak
- fluctuation
- growth
- increase
- rise
- slump
- Noun phrase + verb + adverb
Example:
The price of oil rose gradually.
The price of oil has risen dramatically.


Possible verbs:
- rise
- jump
- grow
- climb
- increase
- rocket
- fall
- drop
- decline
- decrease
- go down
- plummet
- plunge


Possible adverbs:
- gradually
- moderately
- modestly
- sharply
- dramatically
- slightly
- steeply
- steadily
- significantly
- considerably
- rapidly
- slowly


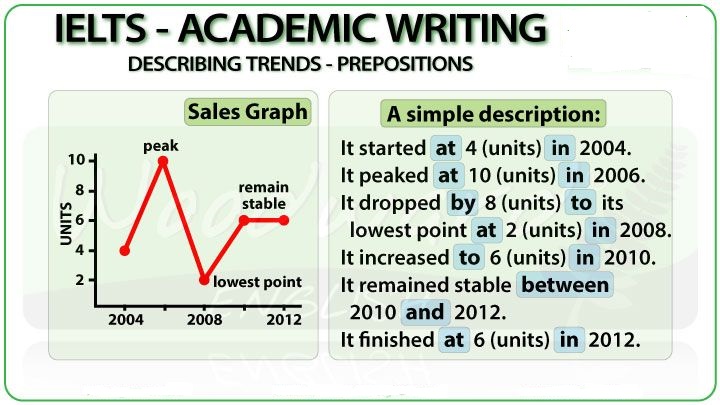
Tenses used in IELTS Writing Task 1 :
Using the appropriate tenses in IELTS writing task 1 is essential if you want to get a high band score.
The key is to look at the title of the chart and the information contained on both axes to establish what time frame is used. This will help you establish what tense you should use.
Example:
- If the time is one point in the past, for example January 1990, then we should use the past tense.
- If it has projections for the future, for example 2045, we use future tenses.
- It there is no time, we use present simple.
Below are a range of tenses that could be used in task 1. Remember, the tense you use will depend on the information displayed in the graph. This is not a complete list of tenses and an awareness of all the English tenses will help you achieve the IELTS score you need.
- Present Perfect:
We use this tense generally to talk about an action that happened at an unspecified time before now. The exact time period is not important.
In writing task 1, we use this tense to talk about changes in data that have happened over a period of time.
Example
The price of oil has fallen by $5 a barrel every week since July.
- Present Perfect Continuous
We use this tense to show that something started in the past and has continued up until now.
Example
Oil prices have been decreasing since July.
- Future Perfect
We use this tense to state that something will be finished by a particular time in the future.
We often use it with ‘by’ or ‘in’.
Example
The price of oil will have reached $300 a barrel by 2020.
- Past Simple
Use this tense to talk about an action that started and finished at a specific time in the past.
Example
The price of oil fell from $150 in Jan 2014 to $50 in Jan 2015.
Commonly used Approximations, Percentages and Fractions
In many of the IELTS writing task 1 questions, you will have to deal with percentages. This is a good opportunity to express these percentages in a different way and boost your score. A way of varying this language is to express them as fractions or proportions.
Remember that you should vary your language as much as possible in order to score high in the ‘lexical resource’ part of the test.
For instance, use approximations. E.g. 49% can be expressed as “nearly a half”.
Below are a range of expressions that can be used to express percentages.
Fractions
73%- nearly three quarters
51%- just over a half
49%- just under a half
32%- nearly a third
3%- a tiny fraction
50%- exactly a half
26%- roughly one quarter
49%- around a half
24%- almost a quarter
77%- approximately three quarters
Proportions
70%- a large proportion
71%- a significant majority
15% a small minority
3%- an insignificant minority
Sample Topic :
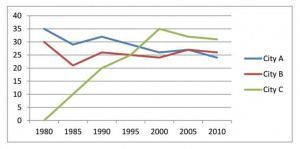
Here is the IELTS Writing Task 1 Line Graph :
The graph shows the information about the international conferences in three capital cities in 1980 – 2010

IELTS Writing Task 1 Sample Answer :
The given line graph compares three capital cities in terms of the number of international conferences hosted between 1980 and 2010.
Overall, it is clear that the number of international conferences in City A and City B declined over this period. In contrast, in City C the number of such conferences saw a rapid increase until the year 2000.
In 1980, there were 35 international conferences in City A, compared with 30 in City B. Despite similar fluctuations, these figures then decreased overall, until in 2005 both cities hosted 27 conferences. By 2010, conferences in City B had overtaken the number in City A, with 26 and 24 international conferences respectively.
City C held no international conferences in 1980. However, it was the venue for 20 conferences in 1990, and by the year 2000 this figure had risen dramatically to 35. According to given graph, the number then remained higher than in the other two cities, although it fell slightly to 31 conferences by the end of the period.

Like and Subscribe our Youtube channel Way To Crack IELTS.