
WRITING TASK 1
You should spend about 20 minutes on this task.
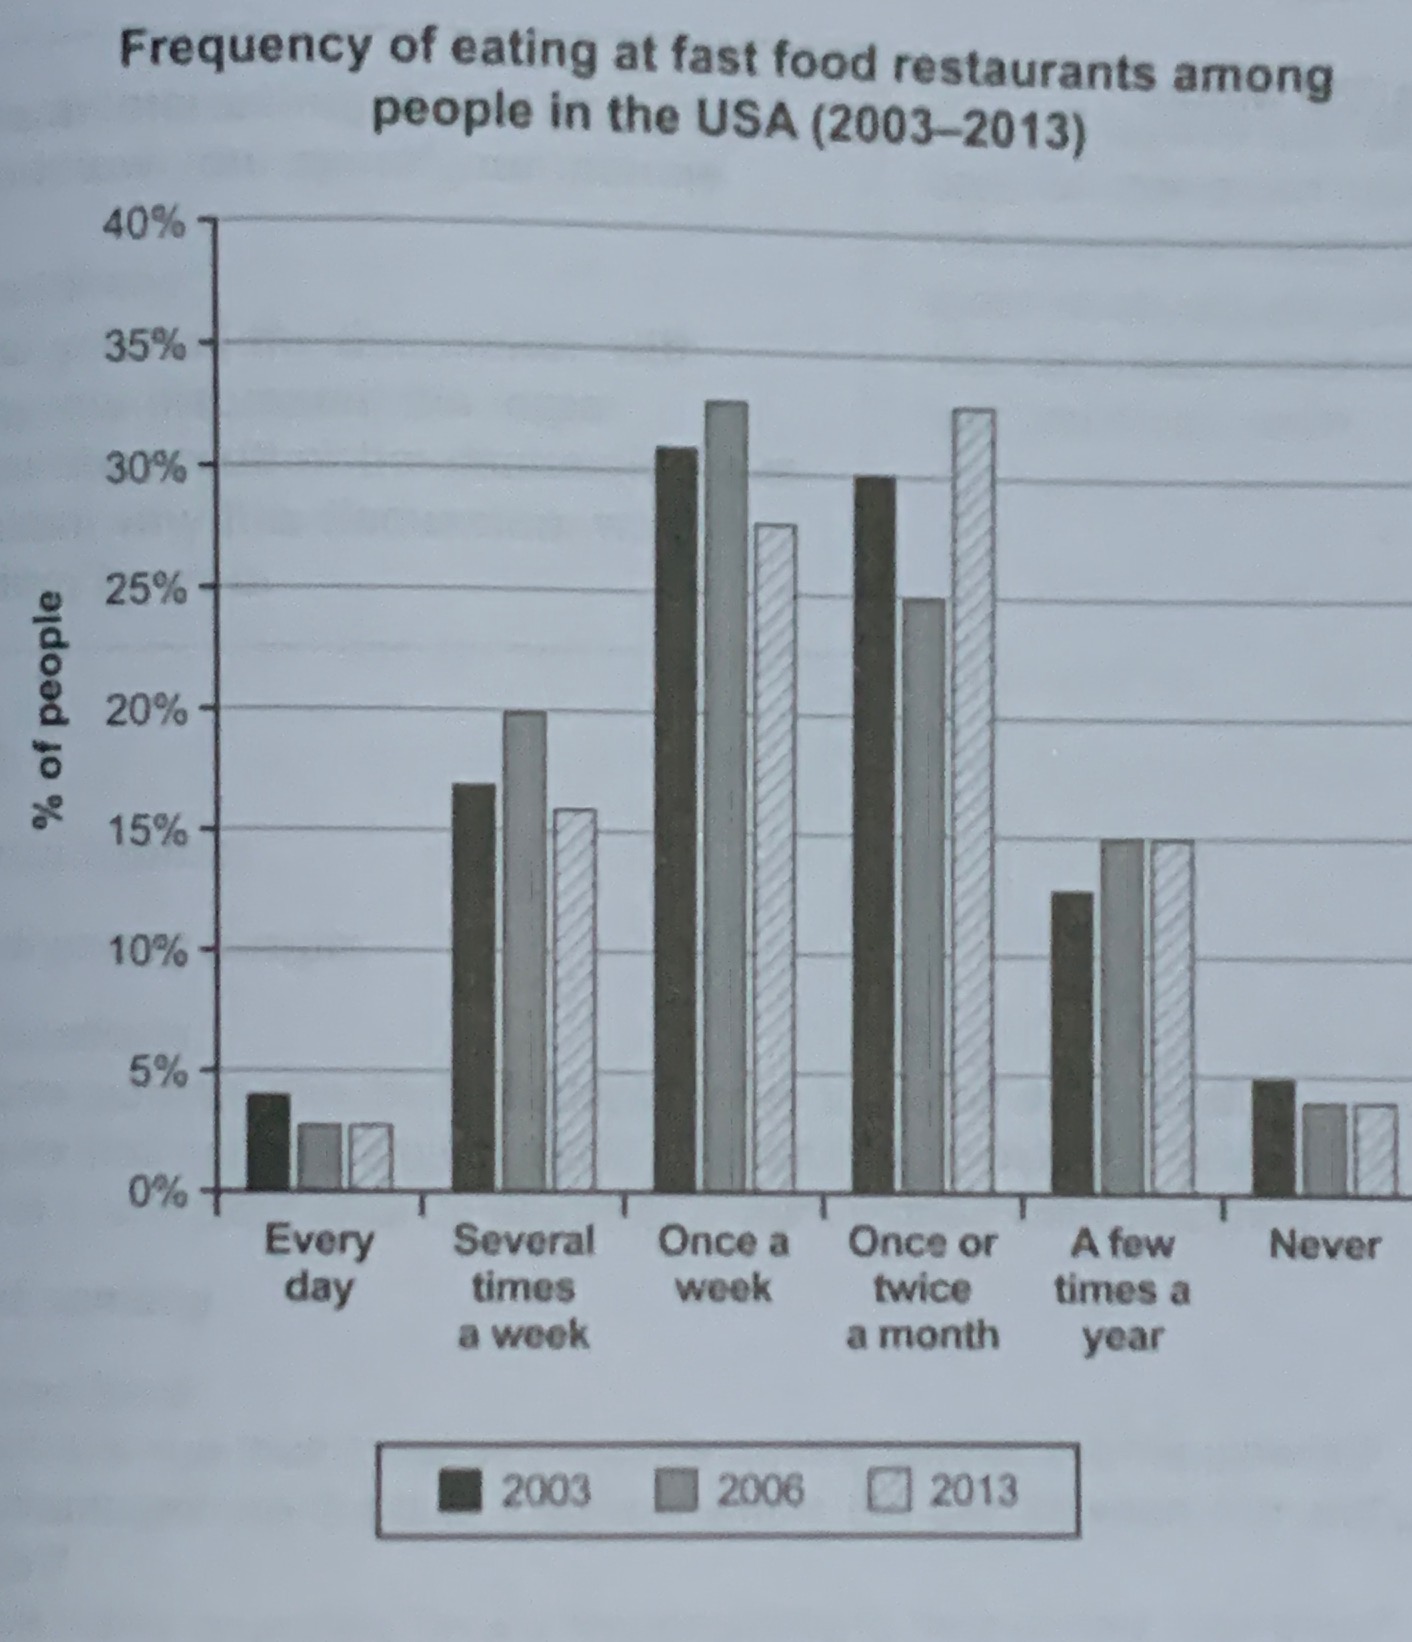
The chart below shows how frequently people in the USA ate in fast food restaurants between 2003 and 2013.
Summarise the information by selecting and reporting the main features, and make comparisons where relevant.
Write at least 150 words.

SAMPLE ANSWER
The given chart visualizes how often the US citizens be at the fast food restaurants in the year 2003, 2006 and 2013.
From 2003 to 2006, the percentage of people who have never eaten at a fast food restaurant has dropped by 1%, but on the other hand during the same period the number of customers who eat fast food everyday has fallen to about 3% of the population. Since 2006, no other changes have occurred in these section of the chart.
The major changes can be seen in the groups, who prefer to eat in a fast food restaurants on a weekly basis and in the groups in which people visit the fast food restaurants once or twice a month or once a few months. While in 2006 most of the United States citizens ate at such facilities at least once a week, in 2013 most of the population did so only once or twice a month. It’s clear that the fast food restaurants were most popular in 2006 and least popular in 2013. However, the number of people who eat in such restaurants only a few times every year did not change.
As a whole, with the exception of people who rarely or never eat fast food and in addition, the small portion of the population who eat every day, the highest of going to fast food restaurants was reached in 2006 in contrast with 2013 when most of the population spent time in them only once or twice a month.
(235 words).
SAMPLE ANSWER 2
The diagram pictures how frequently the US residents be at the drive-through joints in the year 2003, 2006 and 2013.
From 2003 to 2006, the level of individuals who have never eaten at a drive-through eatery has fallen by 1%, however then again during a similar period the quantity of customers who eat cheap food ordinary has tumbled to about 3% of the populace. Since 2006, no different changes have happened in these fragments of the graph.
The significant changes can be found in the gatherings, who eat in a drive-thru eateries on a week by week premise and in the gatherings wherein individuals visit the drive-through joints on more than one occasion per month or once a couple of months. While in 2006 the greater part of the US residents ate at such offices in any event once per week, in 2013 the vast majority of the populace did so just a single time or two times every month. Obviously the drive-through eateries were generally well known in 2006 and least famous in 2013. In any case, the quantity of individuals who eat in such cafés just a couple of times each year didn’t change.
All in all, except for individuals who once in a while or never eat cheap food and also, the little piece of the populace who eat each day, the pinnacle of going to drive-through joints was reached in 2006 conversely with 2013 when the majority of the populace invested energy in them just a single time or two times per month.
(230 Words)
This is an answer to achieve a BAND 6.5 score. Here is the examiner’s comment:
The competitor has given an away from and a review of the key phases of the procedure. Each stage is distinguished and depicted. There is an unmistakable in general movement, which each stage being motioned by proper markers. These markers are sufficient, yet a higher score may be accomplished by changing their situation in each sentence, as opposed to continually setting them toward the start. The scope of jargon is sufficient for the assignment and there are endeavors to be utilized more assortment. There is a blend of straightforward and complex sentence structures, including exact utilization of uninvolved structures. There are a few mistakes, however in any case the degree of exactness is acceptable. A similar degree of precision, over a more extensive scope of sentence structures, would build the score on Grammatical Range and Accuracy.
SAMPLE ANSWER 3
The outline pictures how as often as possible the US occupants be at the drive-through joints in the year 2003, 2006 and 2013.
From 2003 to 2006, the degree of people who have never eaten at a drive-through restaurant has fallen by 1%, anyway on the other hand during a comparative period the amount of clients who eat modest food customary has tumbled to about 3% of the masses. Since 2006, the same changes have occurred in these pieces of the diagram.
The huge changes can be found in the get-togethers, who eat in a drive-through diners on seven days by week premise and in the social events wherein people visit the drive-through joints time and again every month or once a few months. While in 2006 most of the US occupants ate at such workplaces in any occasion once every week, in 2013 by far most of the people did so only a solitary time or multiple times each month. Clearly the drive-through diners were commonly notable in 2006 and least well known in 2013. Regardless, the amount of people who eat in such bistros only a few times every year didn’t change.
All things considered, aside from people who on occasion or never eat modest food and furthermore, the little bit of the masses who eat every day, the zenith of going to pass through joints was reached in 2006 then again with 2013 when most of the masses put vitality in them only a solitary time or two times each month.
SAMPLE ANSWER 4
The layout pictures how as frequently as conceivable the US inhabitants be at the drive-through joints in the year 2003, 2006 and 2013.
From 2003 to 2006, the level of individuals who have never eaten at a drive-through café has fallen by 1%, at any rate then again during a relative period the measure of customers who eat humble food standard has tumbled to about 3% of the majority. Since 2006, similar changes have happened in these bits of the graph.
The immense changes can be found in the parties, who eat in a drive-through coffee shops on seven days by week premise and in the get-togethers wherein individuals visit the drive-through joints consistently or once a couple of months. While in 2006 the greater part of the US tenants ate at such work environments in any event once consistently, in 2013 by a long shot the majority of the individuals did so just a singular time or on different occasions every month. Plainly the drive-through burger joints were normally eminent in 2006 and least notable in 2013. Notwithstanding, the measure of individuals who eat in such bistros just a couple of times each year didn’t change.
Taking everything into account, beside individuals who once in a while or never eat unassuming food and moreover, the smidgen of the majority who eat each day, the apex of going to go through joints was reached in 2006 on the other hand with 2013 when the majority of the majority put imperativeness in them just a single time or multiple times every month.
Like and Subscribe our Youtube Channel Way To Crack IELTS.